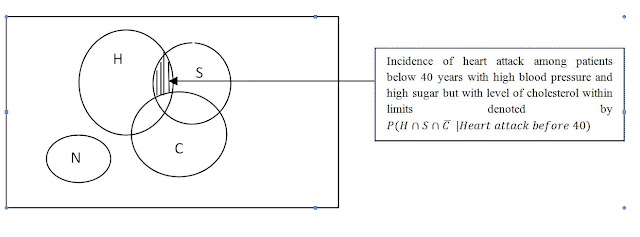
Conditional probability is normally computed under some additional conditions and "unconditional probability" is the probability where no additional conditions are provided. This is illustrated with example mentioned in the previous blog. Here the probability of having a heart attack before 40 years of age is minutely analyzed by a Venn Diagram. The venn diagram below shows a rectangle representing all people ( in an area) below 40 years. The circles H, S, C and N are those who have suffered a heart attack. The other region represents those without a heart attack. The shaded region in the diagram below gives the probability that a patient with high level blood pressure and sugar but the level of cholesterol is within limits has a heart attack before 40 years of age. This is the ratio of number of elements in the shaded region divided by the total number of elements in H, S, C and N.

No comments:
Post a Comment