Sunday, July 30, 2017

Probability and Conditional Probability


The discussion is being continued. 
So,
Y1 stands for  incidence of a heart attack before 40.
Y2 stands for no incidence of a heart attack before 40.
X stands for the event of Blood pressure and Blood sugar beyond normal limits and cholesterol within normal limits.

Expenses on Cardiac Care


Probability and Conditional Probability


Wednesday, July 26, 2017

Probability and Conditional Probability

This is in continuation of the discussion on Probability and Conditional Probability of the Previous Blog.
Now we are using a general notation. Then the equation get's reduced to the following form.

Probability and Conditional Probability

Tuesday, July 18, 2017

Visualization of Probability & Conditional Probability


The tree diagram given in the image below helps visualize the main difference between conditional and unconditional probability. Here we continue with the example of the previous blog where conditions leading to a heart attack before 40 years are minutely analyzed.  

Visualization of conditional probability

Probability and Conditional Probability


Friday, July 14, 2017

Understanding conditional probability through Venn Diagrams

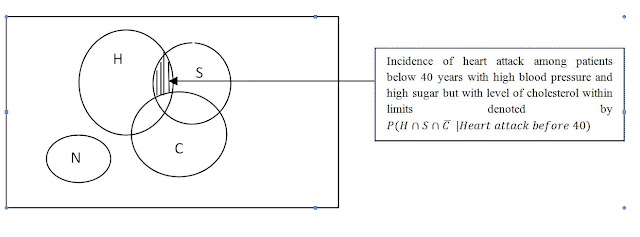
Conditional probability is normally computed under some additional conditions and "unconditional probability" is the probability where no additional conditions are provided. This is illustrated with example mentioned in the previous blog. Here the probability of having a heart attack before 40 years of age is minutely analyzed by a Venn Diagram. The venn diagram  below shows a rectangle representing all people ( in an area) below 40 years. The circles H, S, C and N  are those who have suffered a heart attack. The other region represents those without  a heart attack. The shaded region in the diagram below gives the  probability that a patient with  high level blood pressure and sugar but the level of cholesterol is within limits has a heart attack before 40 years of age. This is the ratio of number of elements in the shaded region divided by the total number of elements in H, S, C and N.

Friday, July 7, 2017

Understanding Venn Diagrams


Incidence of Heart Attack Below 40 years of Age

We are interested in finding the probability of a heart attack below 40 years of age. Venn diagrams help visualize the scenario of people having heart attack before age of 40 including those with high blood pressure denoted by H, high sugar denoted by S and high cholesterol denoted by C or a combination of these. N denotes those individuals who have stroke before 40 and have blood pressure, sugar and cholesterol within normal limits. The image below shows the venn diagram of those cases where the blood pressure and sugar are beyond normal limits but cholesterol is within the limits.  This way all the possible causes resulting to a heart attack before 40 years can be minutely analyzed and it's probability can be calculated. This analysis is based on collected data and can aid in correct diagnosis.


This venn diagram shows probability of a stroke with high levels of blood pressure and blood sugar